When it comes to allergies, we don’t mess around. We know just how much our customers with allergies suffer during spring allergy season where allergens are kicked up into the air and spread across state lines. Trying to plan activities or even simply living in your own space can become tumultuous when you are constantly battling irritants left and right. While many praise allergen maps for their ability to show local pollen counts, it becomes progressively harder to account for allergens days before they are present – especially as pollen doesn’t conform to state boundaries like pollution.

It’s much easier and more accurate to use weather patterns and forecasts to help identify potential allergen issues and where they are likely to affect. Not only do weather forecasts provide live updates, but they also tend to show the pattern and migration of allergens. How is this possible? First, lets get one thing straight, rain does not help settle allergens or wash them from the air. Rain ruptures the protective coating of pollen, allowing the fragmented pieces to remain in the air where they can be inhaled. Ultimately it comes down to the fact that allergens are often carried by winds and rainstorms, which allows them to travel near and far, impacting people nationwide and even globally.
Spring 2024 Predictions


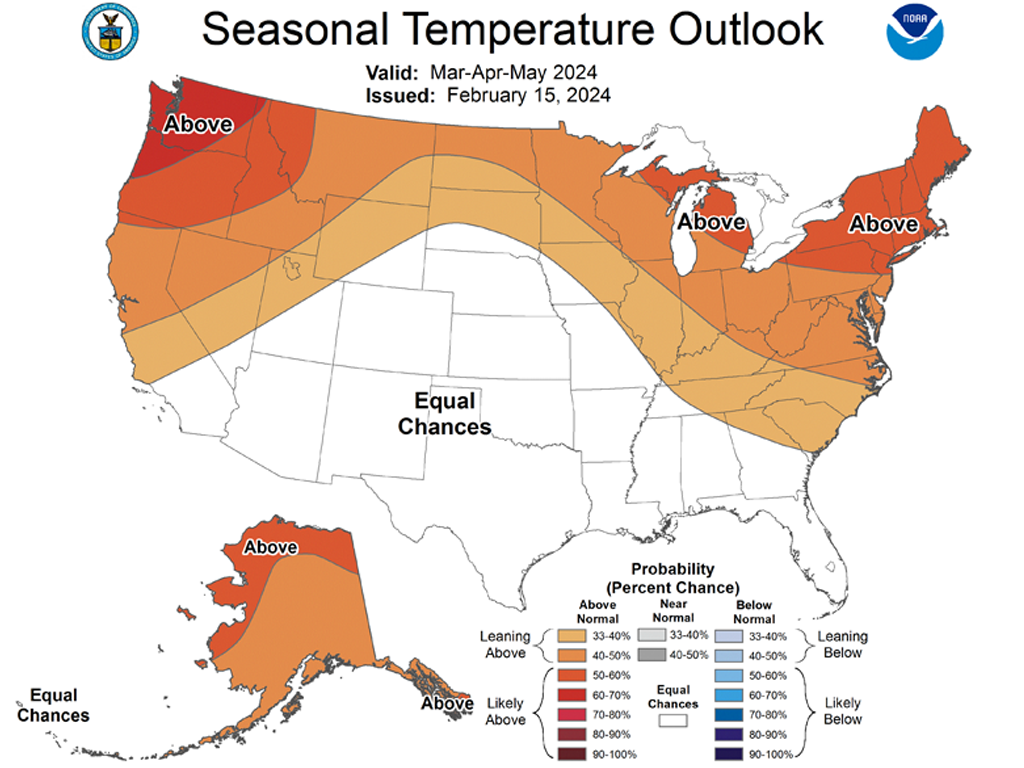
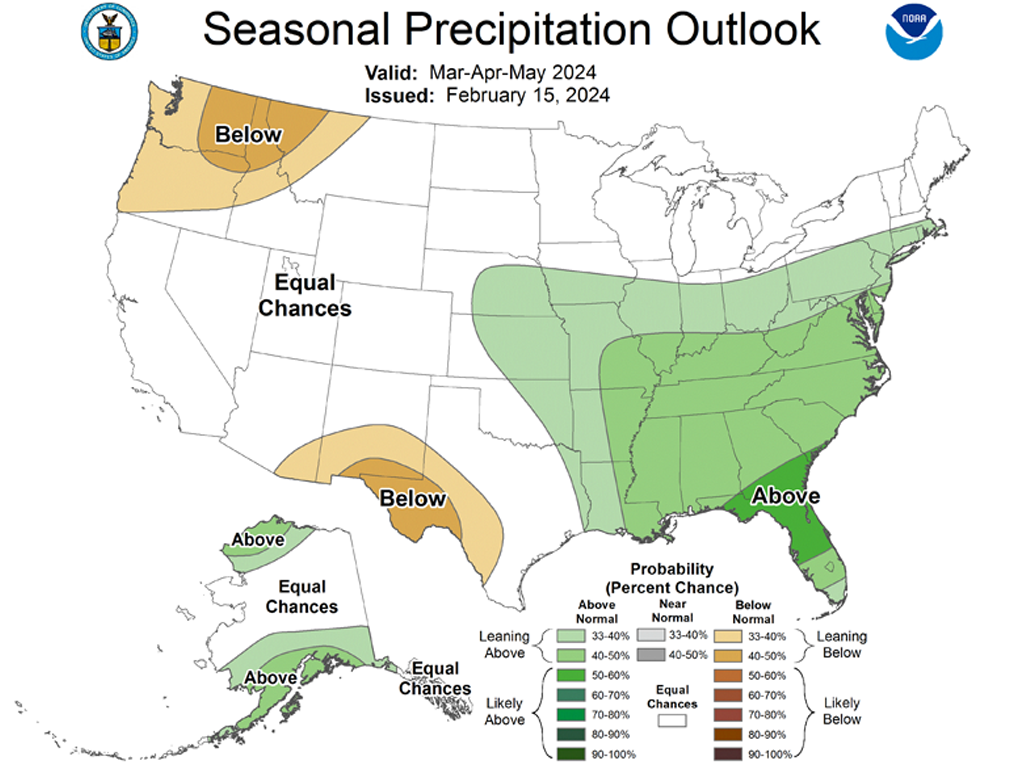
Above are two maps showing the season temperature and precipitation outlooks for March, April, and May of 2024. A general summary of the date presented shows that the Northeast is expected to be above average temperatures with below average precipitation; the Northeast is also expected to see temperatures above average with an equal chance for above average precipitation; the Southeast is expected to experience the highest chance for precipitation with equal chances for above average temperatures.
What Does Any of This Mean?
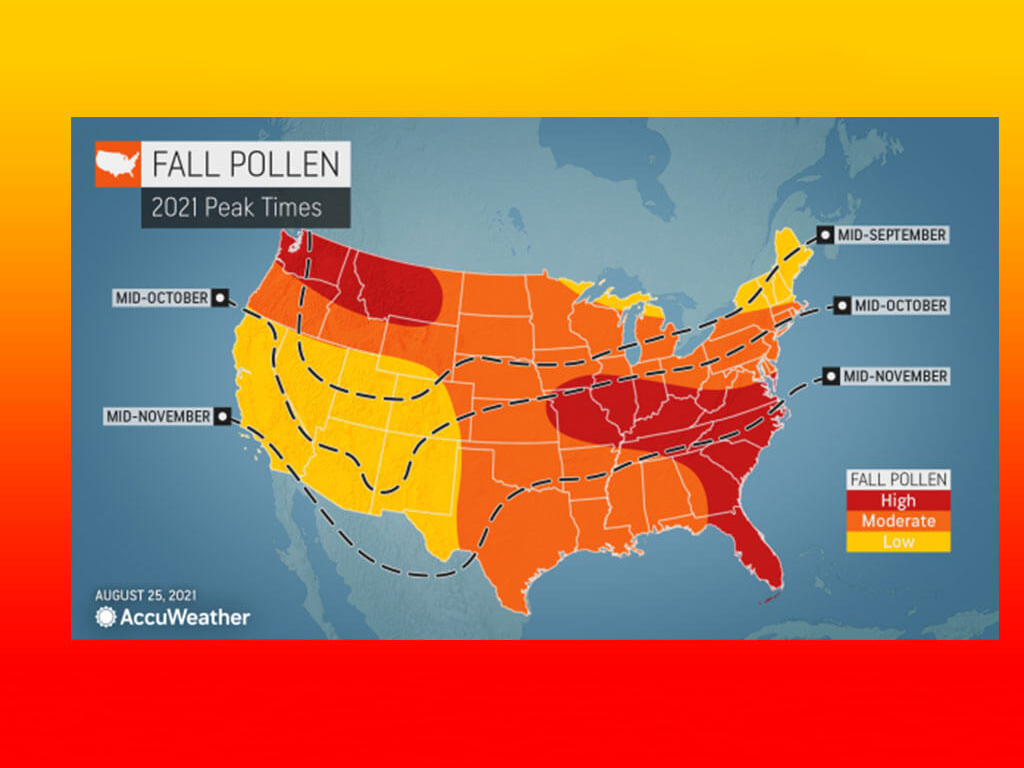
Remember that allergen map from the beginning? Does it look familiar to any of the other maps?


The main similarity or trend between the two maps is a high concentration of increased precipitation and allergens for the Southeastern portion of both maps. This trend allows you to see the relationships between precipitation levels and the presence of allergens. Viewing all three of the maps can help you plan for allergen issues this spring; however, it can also help you begin to identify potential problems that can occur due to conditions of their environment.
A review paper from the National Library of Medicine theorizes that the winds from thunderstorms carry pollen grains from the ground level up toward the humid bases of storm clouds. The grains burst and release allergy-inducing starch particles, which make their way to breathing air where the pollen fragments can be inhaled much more deeply than whole pollen kernels.
For example, anyone living in areas with above average precipitation AND temperature can expect to be dealt a hand of mold or mildew simply because it’s hot and wet. The Northwestern states that receive below average precipitation at high altitudes with above average temperatures might consider purchasing a humidifier to help make breathing easier.
Along with allergens, heavy precipitation tends to bring along particles of sand, dirt, grass, and anything else that might be lying on the ground or is kicked up into the air. For those who live in the high allergen and high precipitation area, we recommend purchasing an air purifier that is equipped to deal with allergens, particulate matter, and more. Protect the air you breathe with a device Powered by ActivePure. For those with high-sensitivity to pollen and other particulate-driven allergies, we recommend one of our products that combines ActivePure with a HEPA filter, such as the Beyond Guardian Air.


